
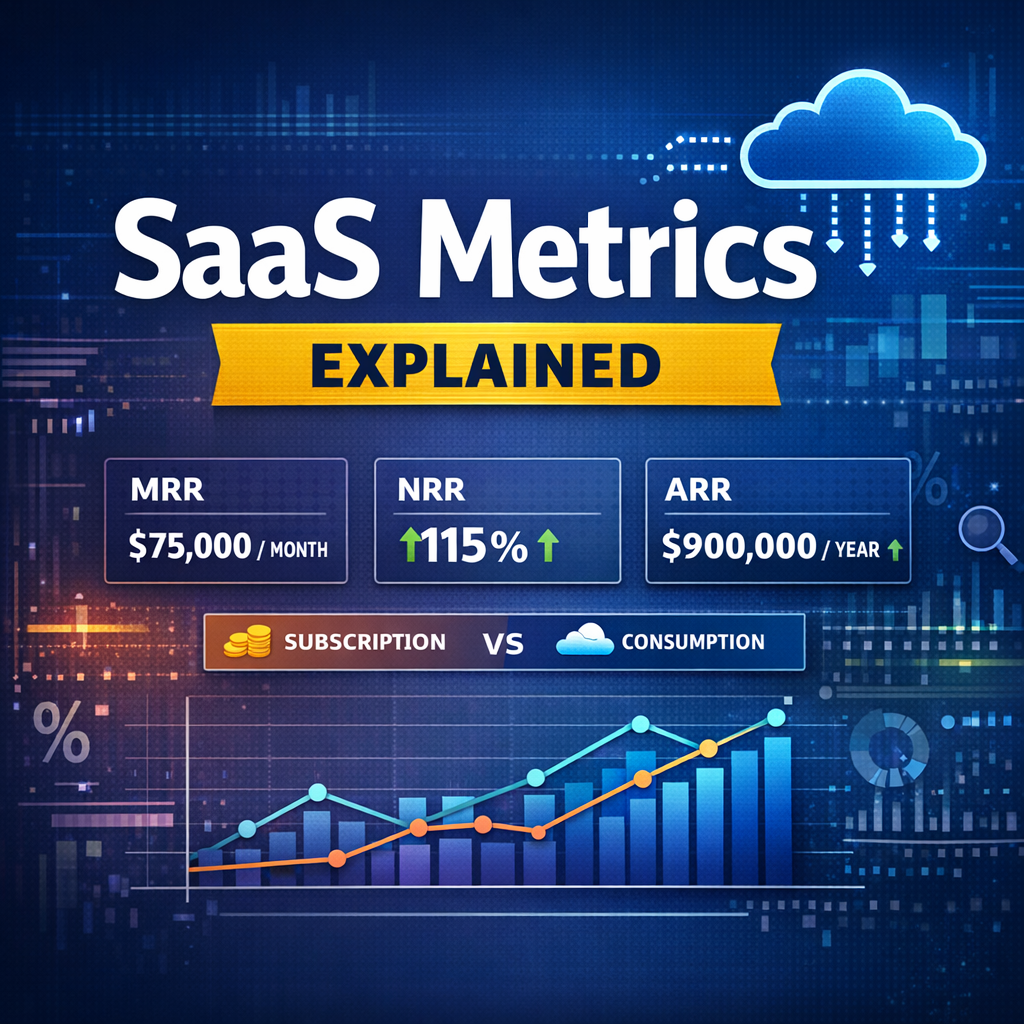
SaaS Metrics Every Revenue Leader Should Understand (With a Consumption-Based Example)
Software-as-a-Service companies rely heavily on data to understand whether their business is growing in a healthy and sustainable way. Metrics such as MRR, ARR, customer acquisition cost, and revenue retention help organizations measure growth, evaluate efficiency, and guide strategic decisions.
For professionals working in Revenue Operations, Product, or Finance, understanding these metrics is essential. They are not just numbers used for reporting — they tell the story of how customers adopt a product, how revenue expands, and whether the business model can scale.
In this article, we’ll explore the most important SaaS metrics using a fictional consumption-based software company to demonstrate how these calculations work in practice.
A Fictional Example: Introducing CloudPulse Analytics
To illustrate the concepts clearly, imagine a software company called CloudPulse Analytics.
CloudPulse provides a cloud platform that helps companies process large volumes of operational data. Instead of selling fixed subscriptions, the company uses a consumption-based pricing model where customers pay for the computing resources they use.
Pricing Model
- Customers purchase processing credits
- Each credit costs $1
- Data processing consumes credits depending on workload
- Larger customers commit to minimum annual usage
This pricing approach is becoming increasingly common in cloud platforms because revenue grows naturally as customers increase their product usage.
Business Snapshot of CloudPulse
Let’s assume the company has the following business metrics for the month of April.
| Metric | Value |
|---|---|
| Total Customers | 200 |
| Average Monthly Usage | $600 |
| Infrastructure Cost | $40,000 |
| Sales & Marketing Spend | $60,000 |
| New Customers Acquired | 20 |
Total monthly revenue can be estimated by multiplying the number of customers by their average usage.
Monthly Revenue = 200 × $600 = $120,000
Now let’s walk through the key SaaS metrics using this example.
Monthly Recurring Revenue (MRR)
What is MRR?
Monthly Recurring Revenue represents the amount of revenue a SaaS company expects to generate from customers each month.
For traditional SaaS businesses with subscription plans, MRR is straightforward. However, in a consumption-based model, MRR usually reflects average customer usage over time rather than fixed subscription fees.
Formula
MRR = Number of Customers × Average Monthly Revenue per Customer
Example Calculation
Customers = 200
Average Monthly Usage = $600
MRR = 200 × 600 = $120,000
MRR helps businesses track revenue momentum and understand whether their customer base is expanding or contracting.
Annual Recurring Revenue (ARR)
ARR converts monthly recurring revenue into an annual figure. Investors and executives often rely on ARR to measure the long-term scale of a SaaS company.
Formula
ARR = MRR × 12
Example
MRR = $120,000
ARR = $120,000 × 12 = $1,440,000
ARR is particularly useful for comparing the growth trajectory of SaaS companies over time.
Customer Acquisition Cost (CAC)
Customer Acquisition Cost measures how much a company spends to gain a new customer. It includes marketing campaigns, advertising costs, and sales team expenses.
Formula
CAC = Total Sales and Marketing Cost ÷ Number of New Customers
Example
Sales & Marketing Spend = $60,000
New Customers = 20
CAC = $60,000 ÷ 20 = $3,000
This means CloudPulse spends approximately $3,000 to acquire each new customer.
Managing CAC efficiently is critical for sustainable growth.
Customer Lifetime Value (LTV)
Customer Lifetime Value estimates the total revenue a business can expect from a single customer throughout their relationship with the company.
Formula
LTV = Average Monthly Revenue × Customer Lifetime
Example
Average Monthly Revenue = $600
Average Customer Lifetime = 30 months
LTV = 600 × 30 = $18,000
This indicates that a typical CloudPulse customer generates $18,000 in revenue over their lifecycle.
LTV to CAC Ratio
One of the most widely used SaaS performance indicators is the LTV to CAC ratio, which compares the revenue generated from a customer to the cost of acquiring them.
Formula
LTV ÷ CAC
Example
LTV = $18,000
CAC = $3,000
LTV:CAC = 6:1
Most SaaS companies aim for a ratio of at least 3:1, meaning the revenue generated from customers should be three times the acquisition cost.
CloudPulse’s ratio indicates strong unit economics.
Net Revenue Retention (NRR)
Net Revenue Retention measures how revenue from existing customers changes over time. It accounts for customer expansion, downgrades, and churn.
This metric is especially important for consumption-based businesses because revenue growth often comes from increased product usage.
Formula
NRR = (Starting Revenue + Expansion Revenue − Churn) ÷ Starting Revenue
Example
Starting Revenue = $100,000
Expansion Revenue = $25,000
Churn = $5,000
NRR = (100,000 + 25,000 − 5,000) ÷ 100,000
NRR = 120%
An NRR above 100% means existing customers are generating more revenue over time.
High-growth SaaS companies often achieve NRR values between 110% and 140%.
Gross Margin
Gross margin indicates how much revenue remains after covering the direct costs required to deliver the product.
For SaaS companies, these costs often include cloud infrastructure and platform operations.
Formula
Gross Margin = (Revenue − Cost of Service) ÷ Revenue
Example
Revenue = $120,000
Infrastructure Cost = $40,000
Gross Margin = (120,000 − 40,000) ÷ 120,000
Gross Margin = 66%
Higher gross margins allow companies to invest more in product development and customer acquisition.
Customer Growth Rate
Tracking how quickly the customer base grows helps measure market adoption and sales performance.
Formula
Customer Growth Rate = New Customers ÷ Existing Customers
Example
New Customers = 20
Existing Customers = 180
Customer Growth Rate = 20 ÷ 180
Growth Rate = 11.1%
A steady growth rate combined with strong retention indicates healthy business expansion.
Subscription vs Consumption Pricing Models
| Feature | Subscription Model | Consumption Model |
|---|---|---|
| Revenue Structure | Fixed monthly fee | Pay for actual usage |
| Predictability | High | Moderate |
| Expansion Strategy | Plan upgrades | Increased product usage |
| Customer Value | Based on seats or plans | Based on usage growth |
Consumption pricing aligns revenue more closely with customer value and product adoption.
Why SaaS Metrics Matter
SaaS metrics provide critical insights into the health of a business. They allow teams to:
- Forecast revenue more accurately
- Measure the effectiveness of marketing and sales investments
- Identify opportunities for customer expansion
- Improve pricing strategies
- Understand long-term profitability
For Revenue Operations teams, these metrics connect operational systems such as CRM, CPQ, and billing platforms with strategic decision-making.
Final Thoughts
Understanding SaaS metrics is essential for anyone working in modern technology companies. These metrics help organizations move beyond simple revenue tracking and instead focus on sustainable, scalable growth.
In consumption-based companies like our fictional CloudPulse Analytics, revenue expansion is driven by customer usage. As customers rely more heavily on the product, the company grows naturally alongside them.
For professionals working in Revenue Operations, Finance, or Product Strategy, mastering these metrics is key to building data-driven SaaS businesses.
Leave a Reply